Automated Market Data
Extraction & Analysis
Leveraging Python and the Yahoo Finance API to automate historical data retrieval for comparative equity analysis and statistical hypothesis testing.
Languages
Python (Pandas, NumPy, Scipy)
Data Source
yfinance API
Environment
Google Colab / Jupyter
Core Skills
Data Cleaning, Statistical Modeling, API Integration
// Implementation: Data Pipeline
        import yfinance as yf

        import pandas as pd


        tickers = ["DE", "CAT"]

        data = yf.download(tickers, start="2023-01-01", end="2025-12-31")


        # Extract Adjusted Close for returns

        close_data = data['Close'].copy()

        close_data.dropna(inplace=True)


        # Compute Daily Returns

        daily_returns = close_data.pct_change().dropna()

        daily_returns.to_csv("daily_returns.csv")
The Quantitative Advantage
Manually exporting CSVs from financial portals is inefficient for large-scale portfolio management. This script creates a repeatable pipeline that can be scaled from two tickers to an entire index (e.g., S&P 500) with a single variable change.
// Statistical Inference
Hypothesis Testing: T-Stat Analysis
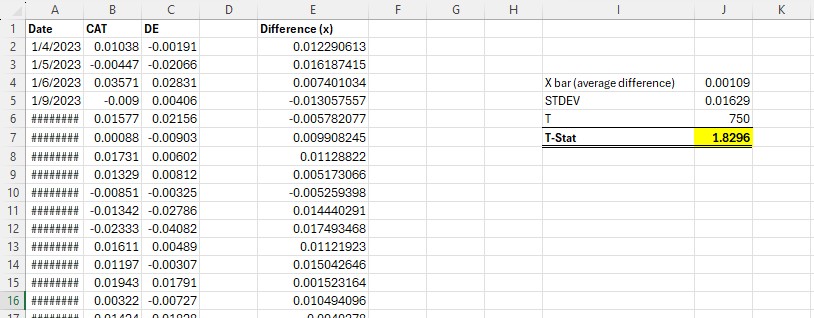
Using the daily_returns dataset, we can perform a Paired T-Test to determine if the mean daily returns of two stocks (e.g., DE vs CAT) are statistically different.
By calculating the p-value, we can conclude whether the stocks track each other due to market beta or if one significantly outperforms/underperforms the other at a 95% confidence interval.
Advanced API Capabilities
Beyond simple price action, the yfinance library allows for deep-dive fundamental analysis:
- Financials: Automate the retrieval of Balance Sheets and Income Statements.
- Options Chain: Pull real-time Greeks and implied volatility for derivative pricing.
- Institutional Holders: Track "Smart Money" movements and insider trading patterns.
- Dividends/Splits: Automatically adjust historical data for corporate actions to maintain backtesting integrity.
// Visualizing Correlation
// Statistical Verdict
Interpretation of Results
The calculated t-stat of 1.83 falls below the critical value threshold of 1.96 (for a 95% confidence interval). Consequently, we fail to reject the null hypothesis.
This indicates that the difference in mean daily returns between the two assets is not statistically significant. From a quantitative perspective, these stocks are effectively "tracking" each other over the observed period, likely due to shared sector exposure and high correlation.
Trading on this information: Pairs Trading
The statistical confirmation that these returns do not significantly differ provides a green light for a Relative Value / Pairs Trading strategy. Because the returns are statistically tied, any short-term divergence in price is likely an anomaly rather than a fundamental shift.
Execution Logic:
- The Signal: When the price ratio between the two stocks moves 2 standard deviations away from the historical mean.
- The Trade: Sell the outperformer (Short) and buy the underperformer (Long).
- The Thesis: Since we accepted the null hypothesis that their returns don't differ long-term, we can bet on Mean Reversion—expecting the "gap" to close as the assets return to their statistical equilibrium.